> ## Documentation Index
> Fetch the complete documentation index at: https://metorial.com/docs/llms.txt
> Use this file to discover all available pages before exploring further.
# Monitoring and Observability
> Metorial provides monitoring tools to help you understand how your providers are performing and debug issues.
**What you'll learn:**
* How to view session logs, messages, and events
* How to debug issues
**References:**
* [Monitoring in Dashboard](/review-activity)
* [Sessions Guide](/concepts-sessions)
## Viewing Logs
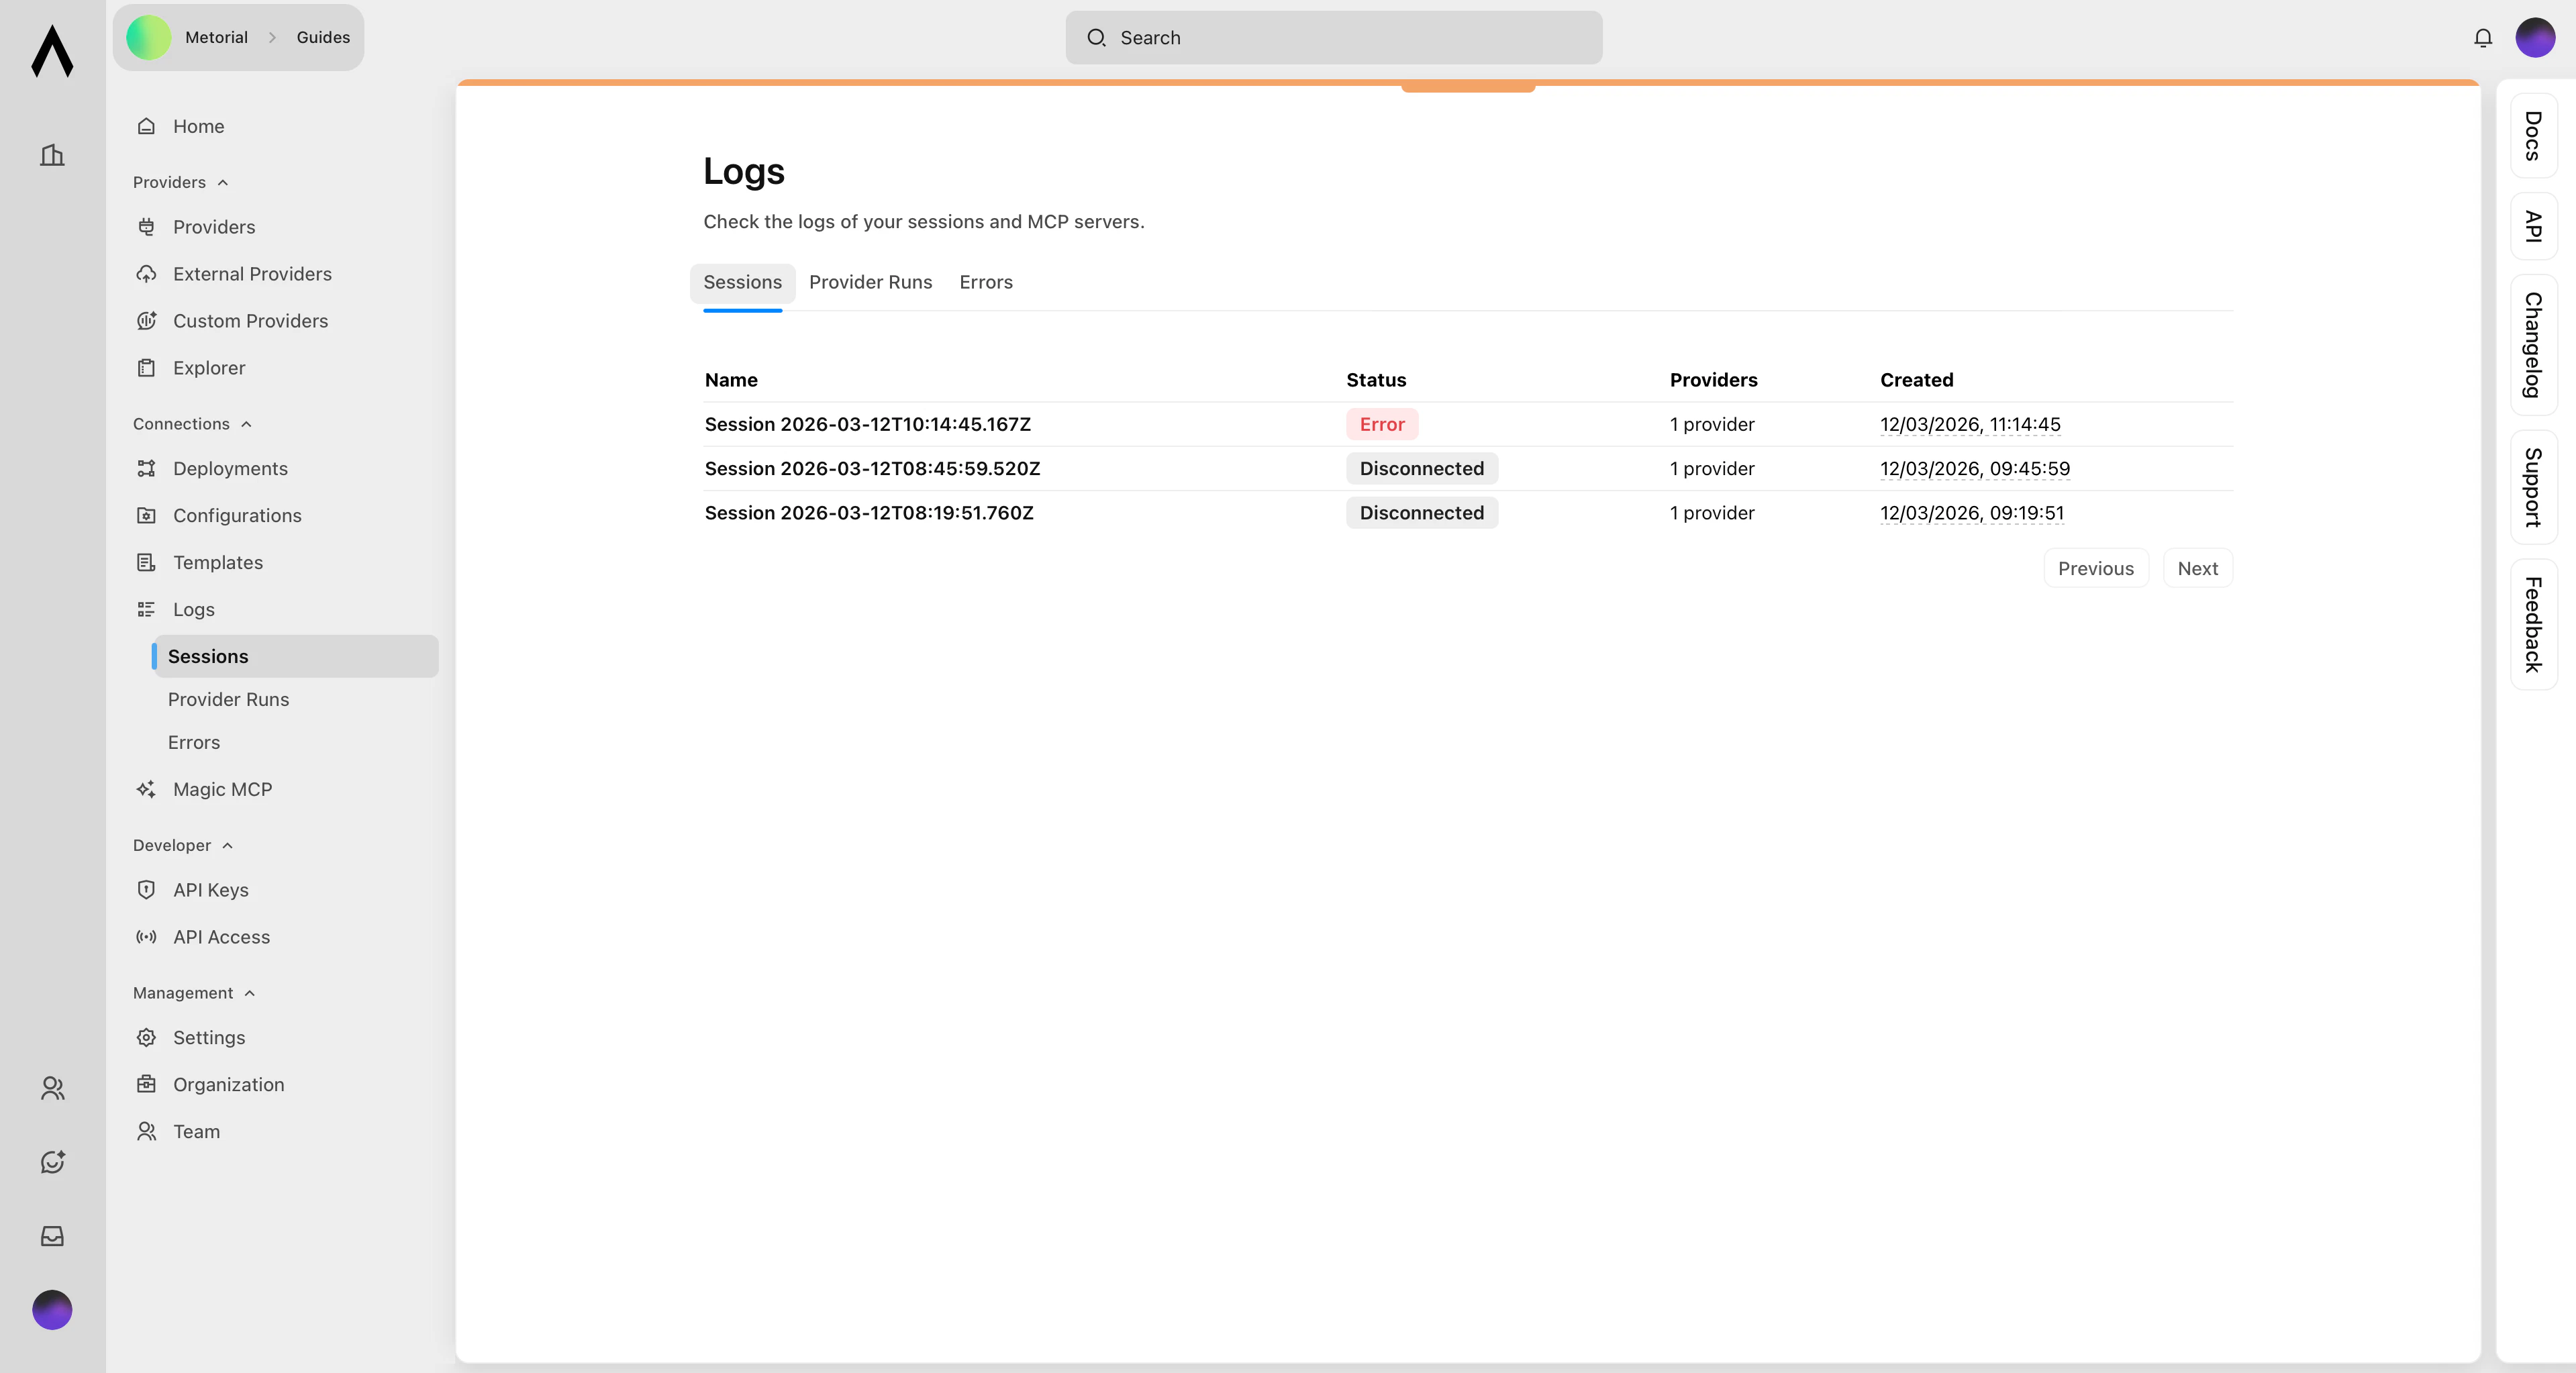
Access logs for your sessions through the Metorial dashboard:
1. Navigate to your project
2. Select the **Logs** tab
 ### Session Logs
See details for each session:
* Creation timestamp
* Providers attached
* Tool calls made
* Any errors
### Tool Call Details
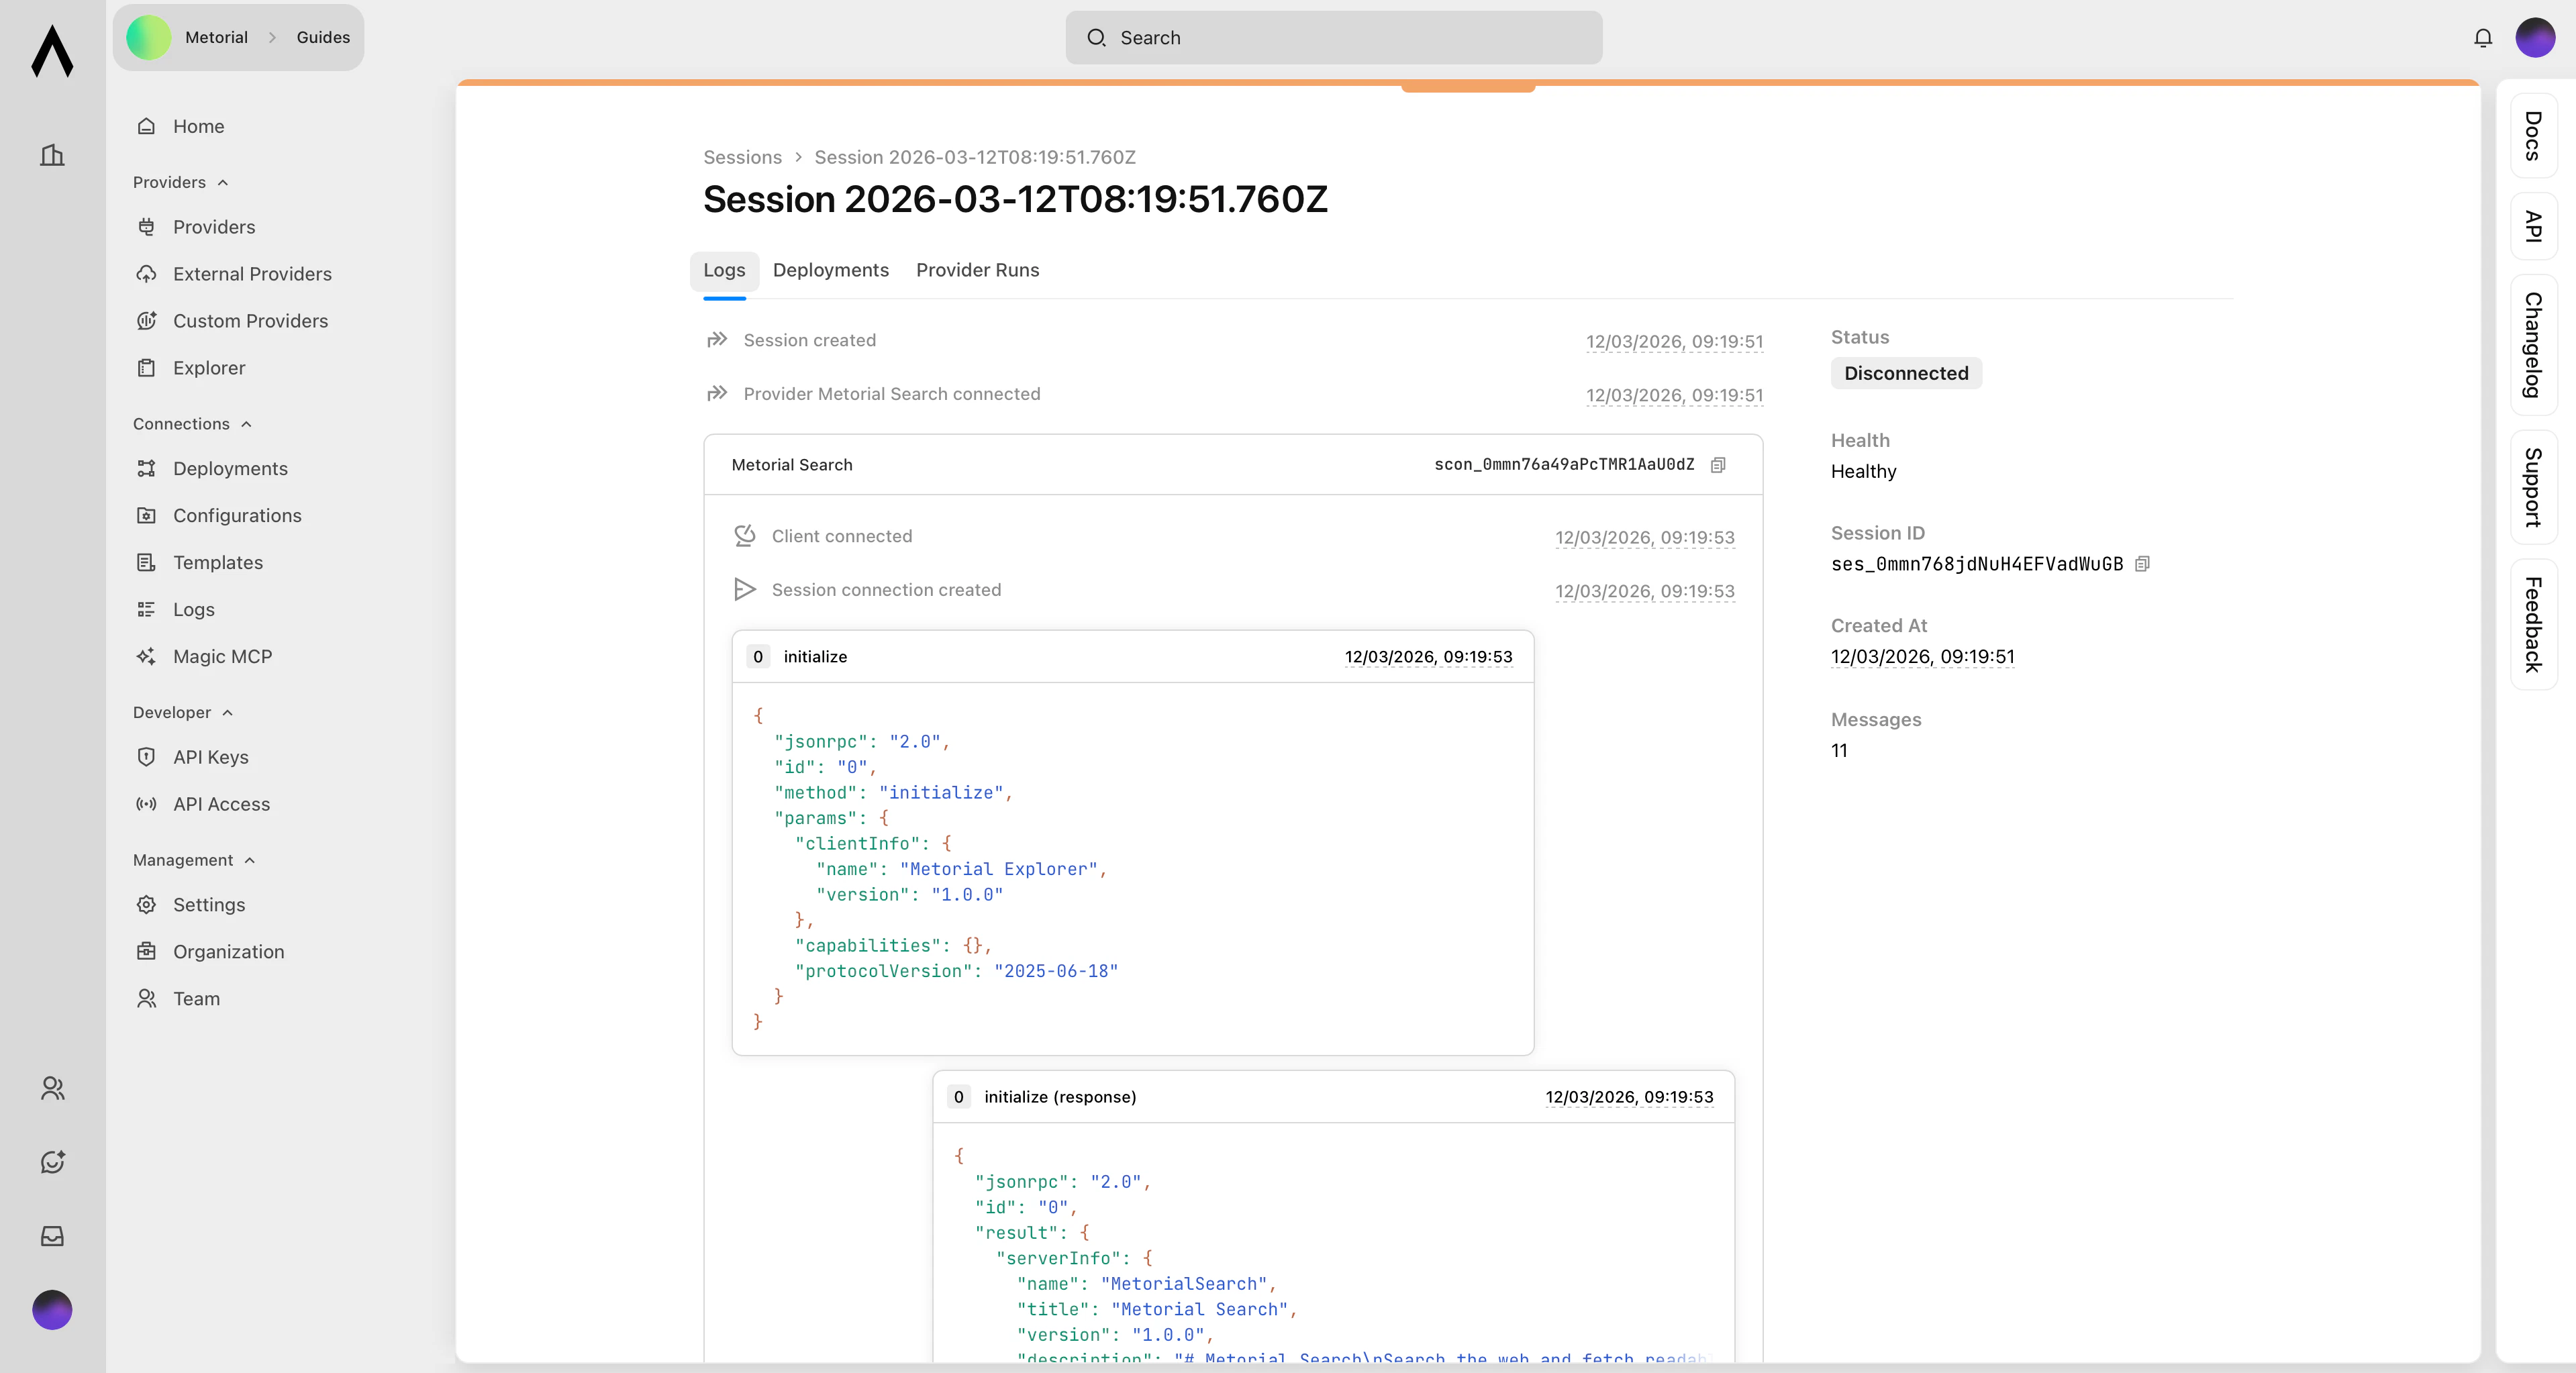
Expand individual tool calls to see:
* Input parameters
* Response data
* Execution time
* Error messages (if any)
### Session Logs
See details for each session:
* Creation timestamp
* Providers attached
* Tool calls made
* Any errors
### Tool Call Details
Expand individual tool calls to see:
* Input parameters
* Response data
* Execution time
* Error messages (if any)
 ## Session Data via API
Sessions expose detailed monitoring data through the API:
### Messages
Every tool call and MCP protocol message is recorded as a **session message**. Each message includes:
* `type`: `tool_call`, `mcp_control`, or `mcp_message`
* `status`: `waiting_for_response`, `succeeded`, or `failed`
* `input` and `output` payloads
* Timing information
### Events
**Session events** capture significant occurrences:
* Connections opening and closing
* Errors
* State changes
### Connections
Each client that connects to a session creates a **connection**. You can inspect connection state (`connected` / `disconnected`), transport type, and usage statistics.
## Debugging Common Issues
### Authentication Errors
* Verify your API key is correct
* Check that provider auth configs exist and haven't expired
* For OAuth providers, the user may need to re-authorize via a new setup session
### Tool Execution Errors
* Verify tool parameters match the schema
* Check for rate limiting from external services
* Review error messages in session logs
**Getting Help**
If you can't resolve an issue:
1. **Export relevant logs** from the dashboard
2. **Note session and provider deployment IDs** for affected sessions
3. **Contact support** at [support@metorial.com](mailto:support@metorial.com)
## What's Next?
Learn more about monitoring your providers.
Handle errors gracefully in your code.
## Session Data via API
Sessions expose detailed monitoring data through the API:
### Messages
Every tool call and MCP protocol message is recorded as a **session message**. Each message includes:
* `type`: `tool_call`, `mcp_control`, or `mcp_message`
* `status`: `waiting_for_response`, `succeeded`, or `failed`
* `input` and `output` payloads
* Timing information
### Events
**Session events** capture significant occurrences:
* Connections opening and closing
* Errors
* State changes
### Connections
Each client that connects to a session creates a **connection**. You can inspect connection state (`connected` / `disconnected`), transport type, and usage statistics.
## Debugging Common Issues
### Authentication Errors
* Verify your API key is correct
* Check that provider auth configs exist and haven't expired
* For OAuth providers, the user may need to re-authorize via a new setup session
### Tool Execution Errors
* Verify tool parameters match the schema
* Check for rate limiting from external services
* Review error messages in session logs
**Getting Help**
If you can't resolve an issue:
1. **Export relevant logs** from the dashboard
2. **Note session and provider deployment IDs** for affected sessions
3. **Contact support** at [support@metorial.com](mailto:support@metorial.com)
## What's Next?
Learn more about monitoring your providers.
Handle errors gracefully in your code.