Review connection logs
Trace session activity and inspect individual tool calls in the dashboard.
Connection logs show how a session moved from connecting to calling a tool. Use them to confirm which provider handled a request, review connection details, and check the arguments and result of a tool call.
What you'll learn
- How to find a session in the connection logs
- How to review connection and provider details
- How to inspect tool calls across one or more sessions
Before you start
- Know roughly when the activity happened
- Know the session or tool you want to inspect, if possible
Trace activity through the logs
Open connection logs
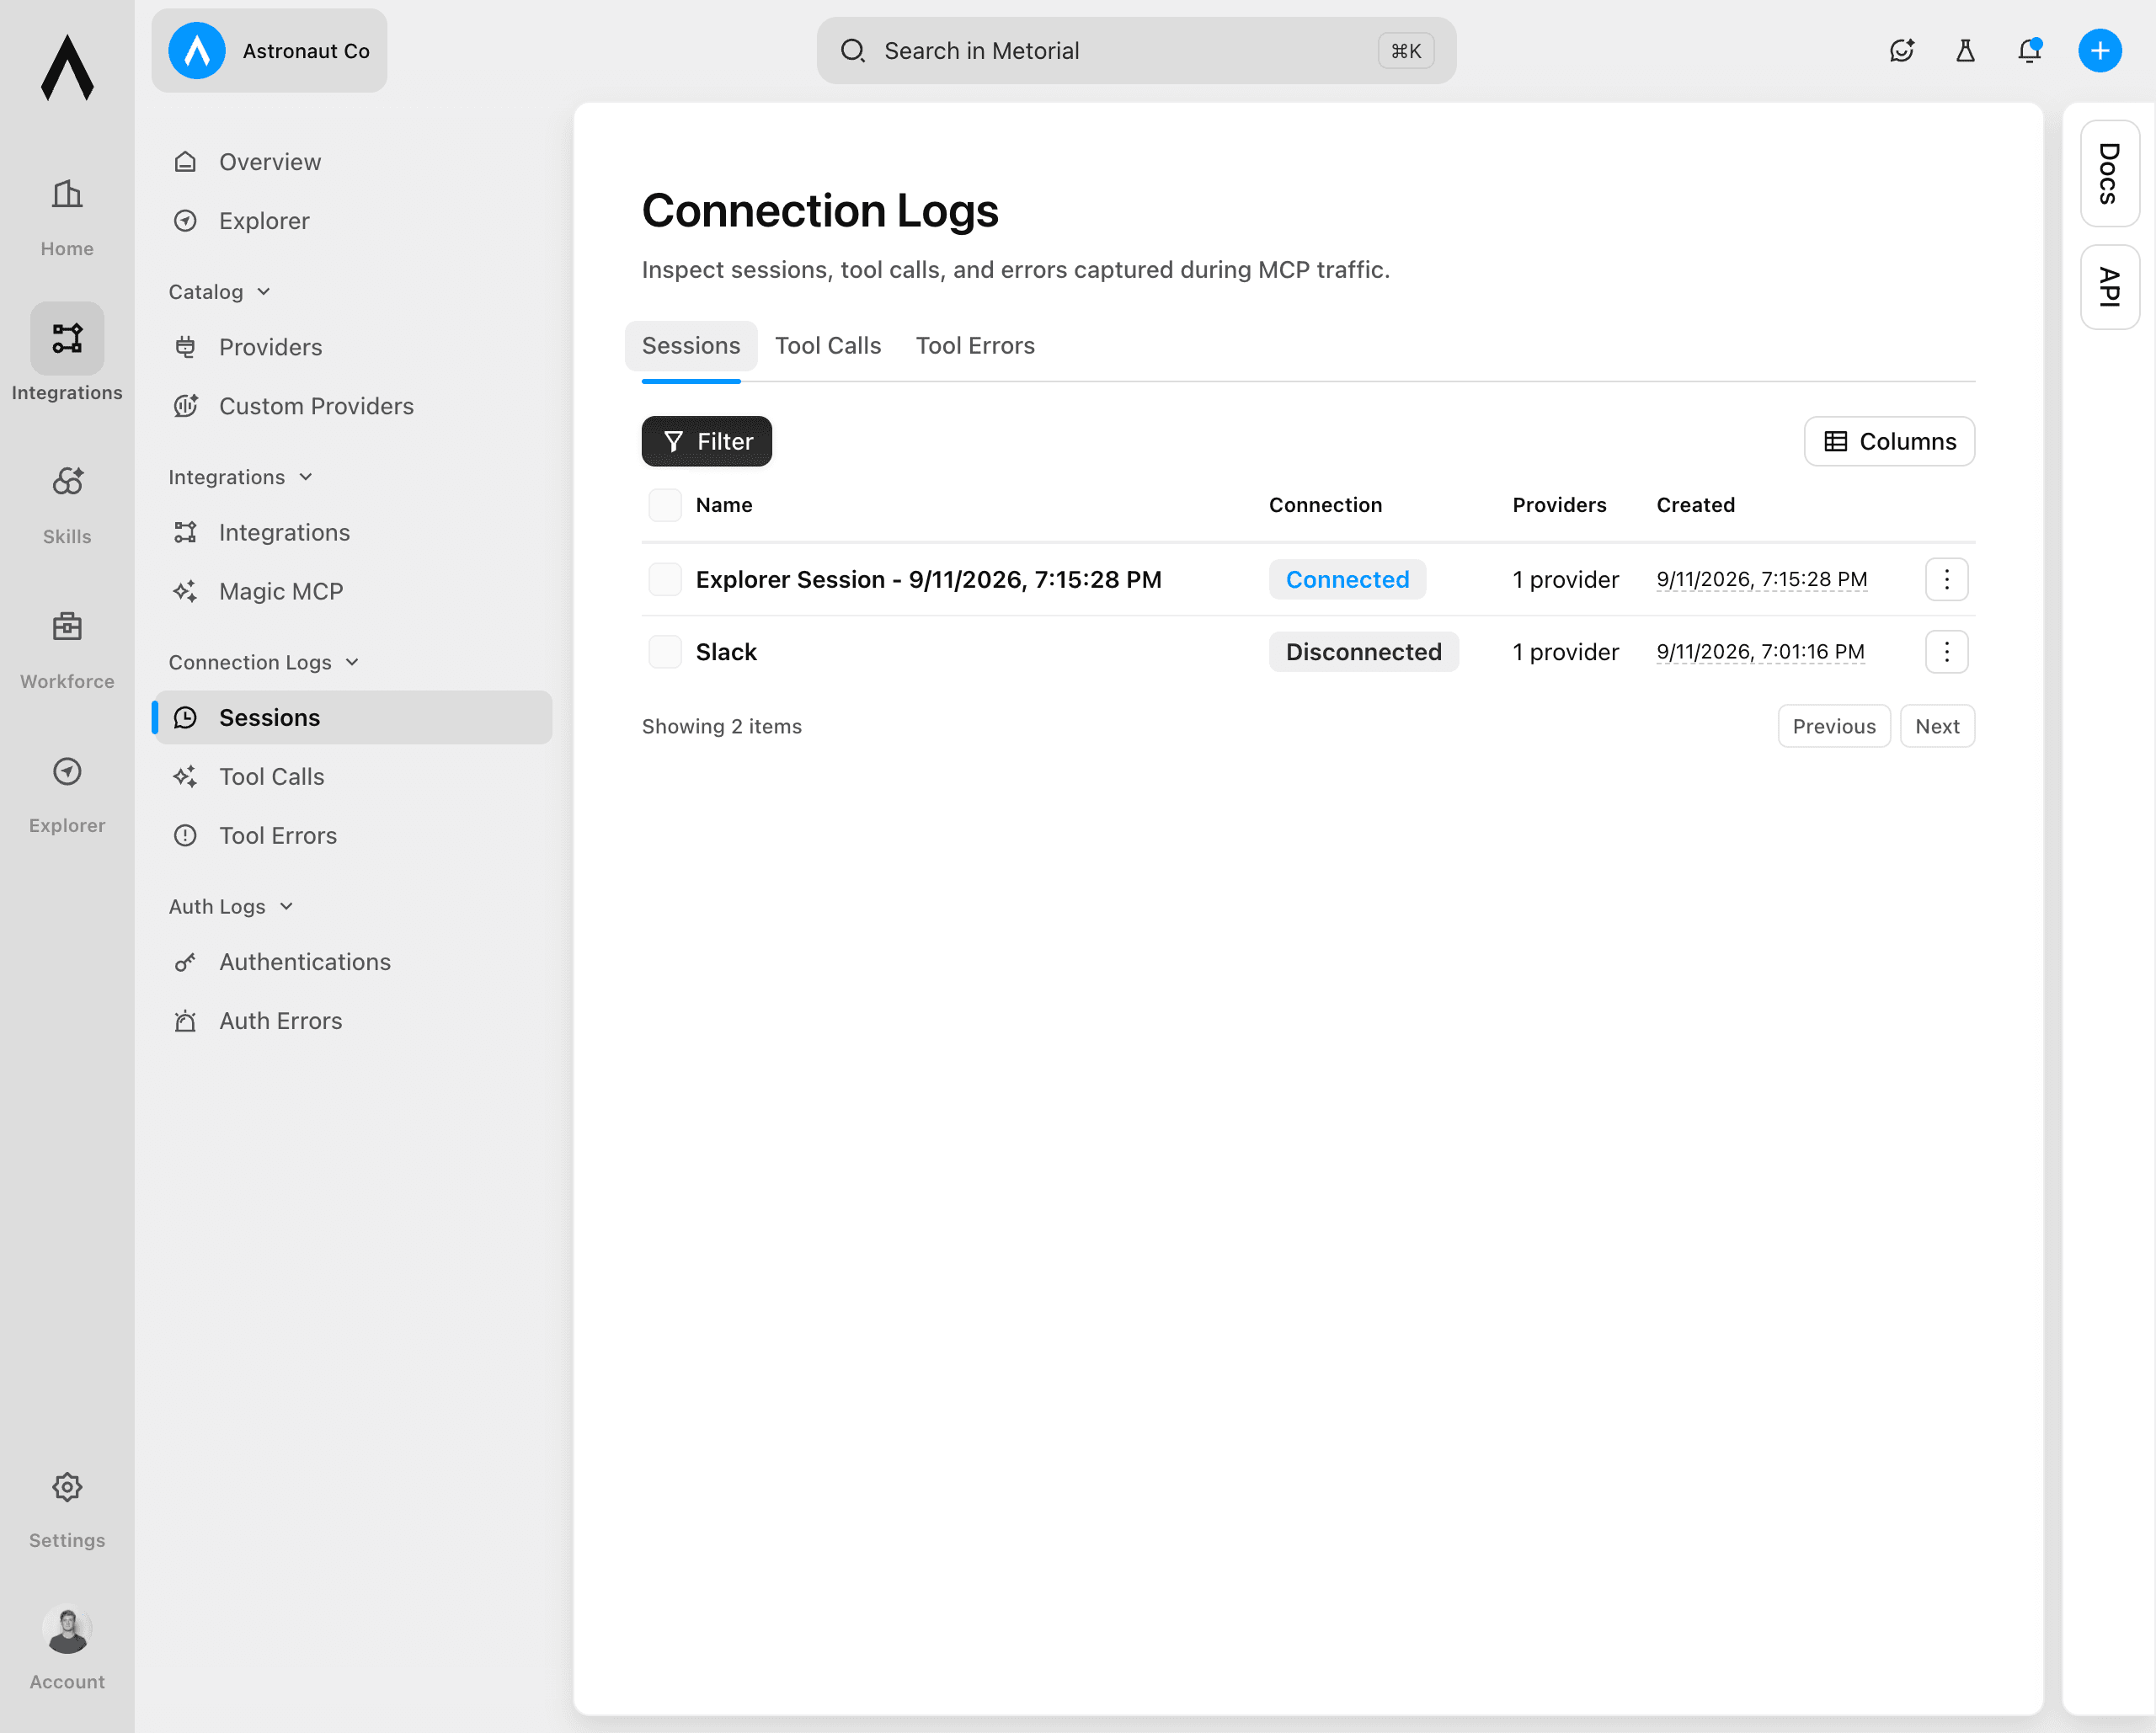
In the dashboard, select Integrations. Under Connection Logs, select Sessions.
Find the session
Review the sessions table. Each row shows the session name, connection status, provider count, and creation time. Use these details to find the activity you want to inspect.
Open the session
Select the session name. If the session has more than one connection, select the relevant entry under Recent Connections.
Review the session context
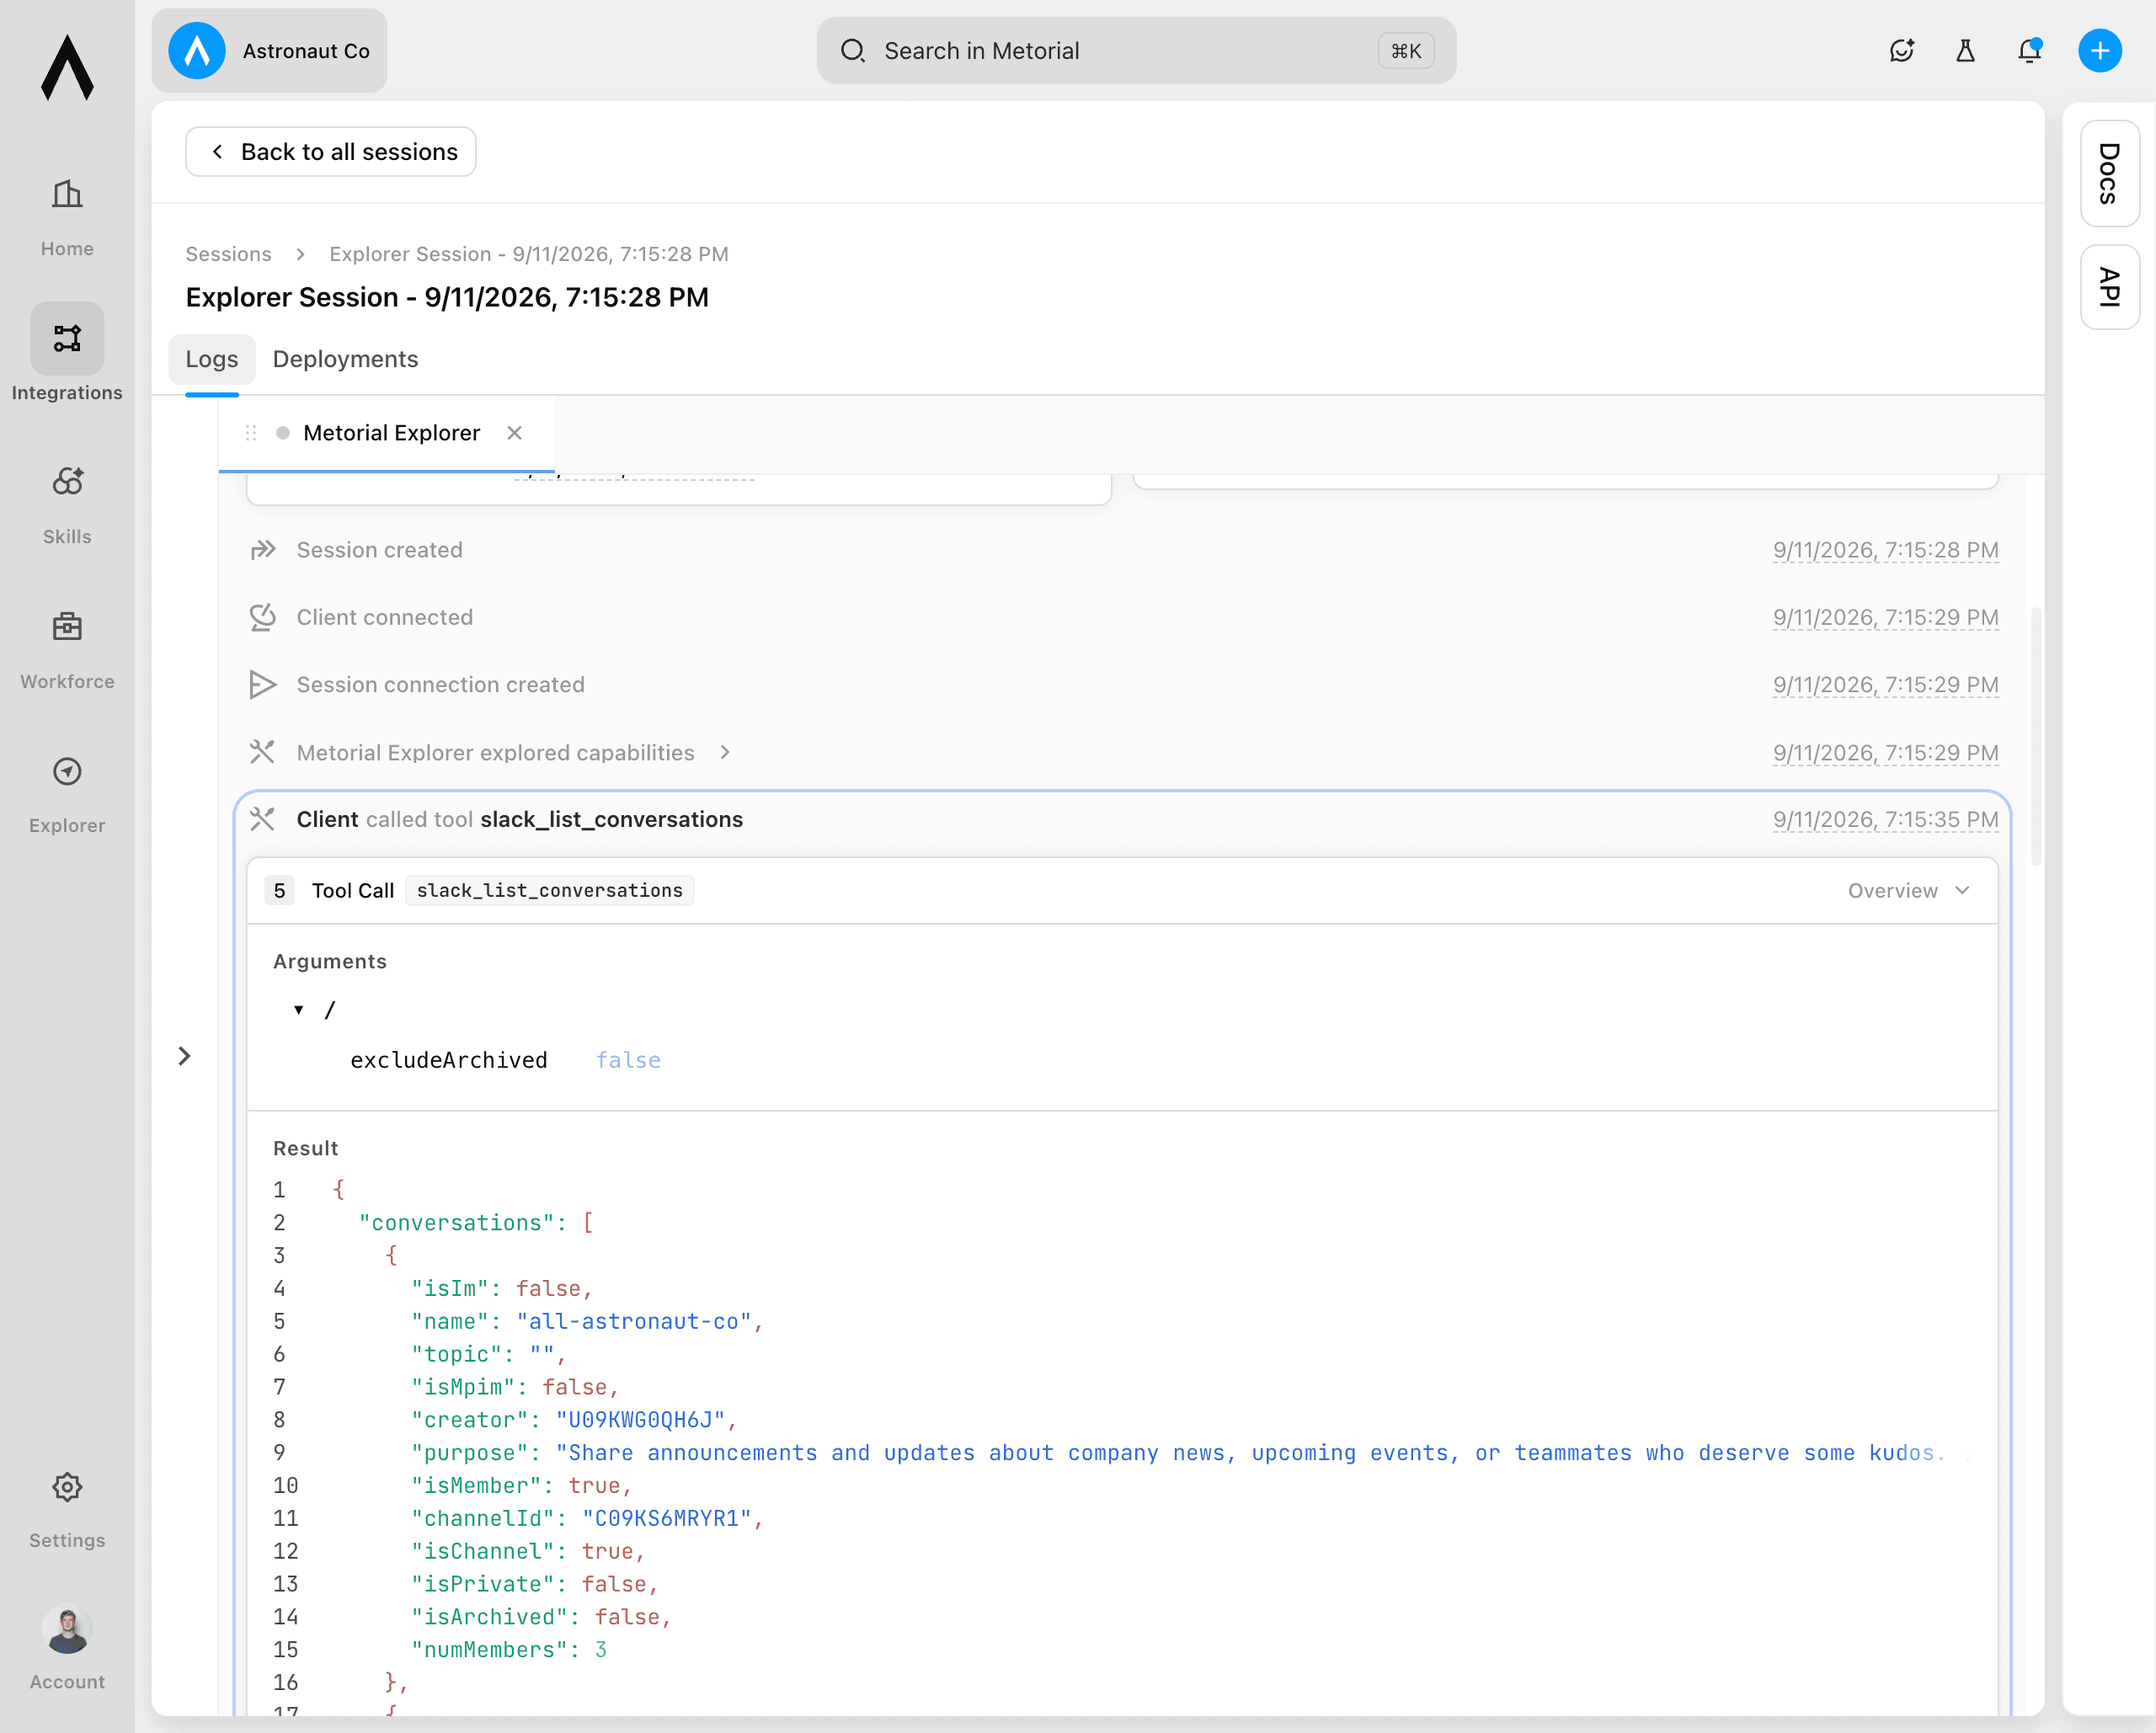
Expand Connection to see the connection ID, transport, message counts, creation time, and last active time. Expand Providers to confirm which provider, deployment, configuration, and authentication configuration were used.
Inspect a tool call
In the session timeline, find a Client called tool event. Open its Tool Call card, then review the tool name, arguments, and result. Check that the arguments match the request and that the result contains the expected data.
Review tool calls across sessions
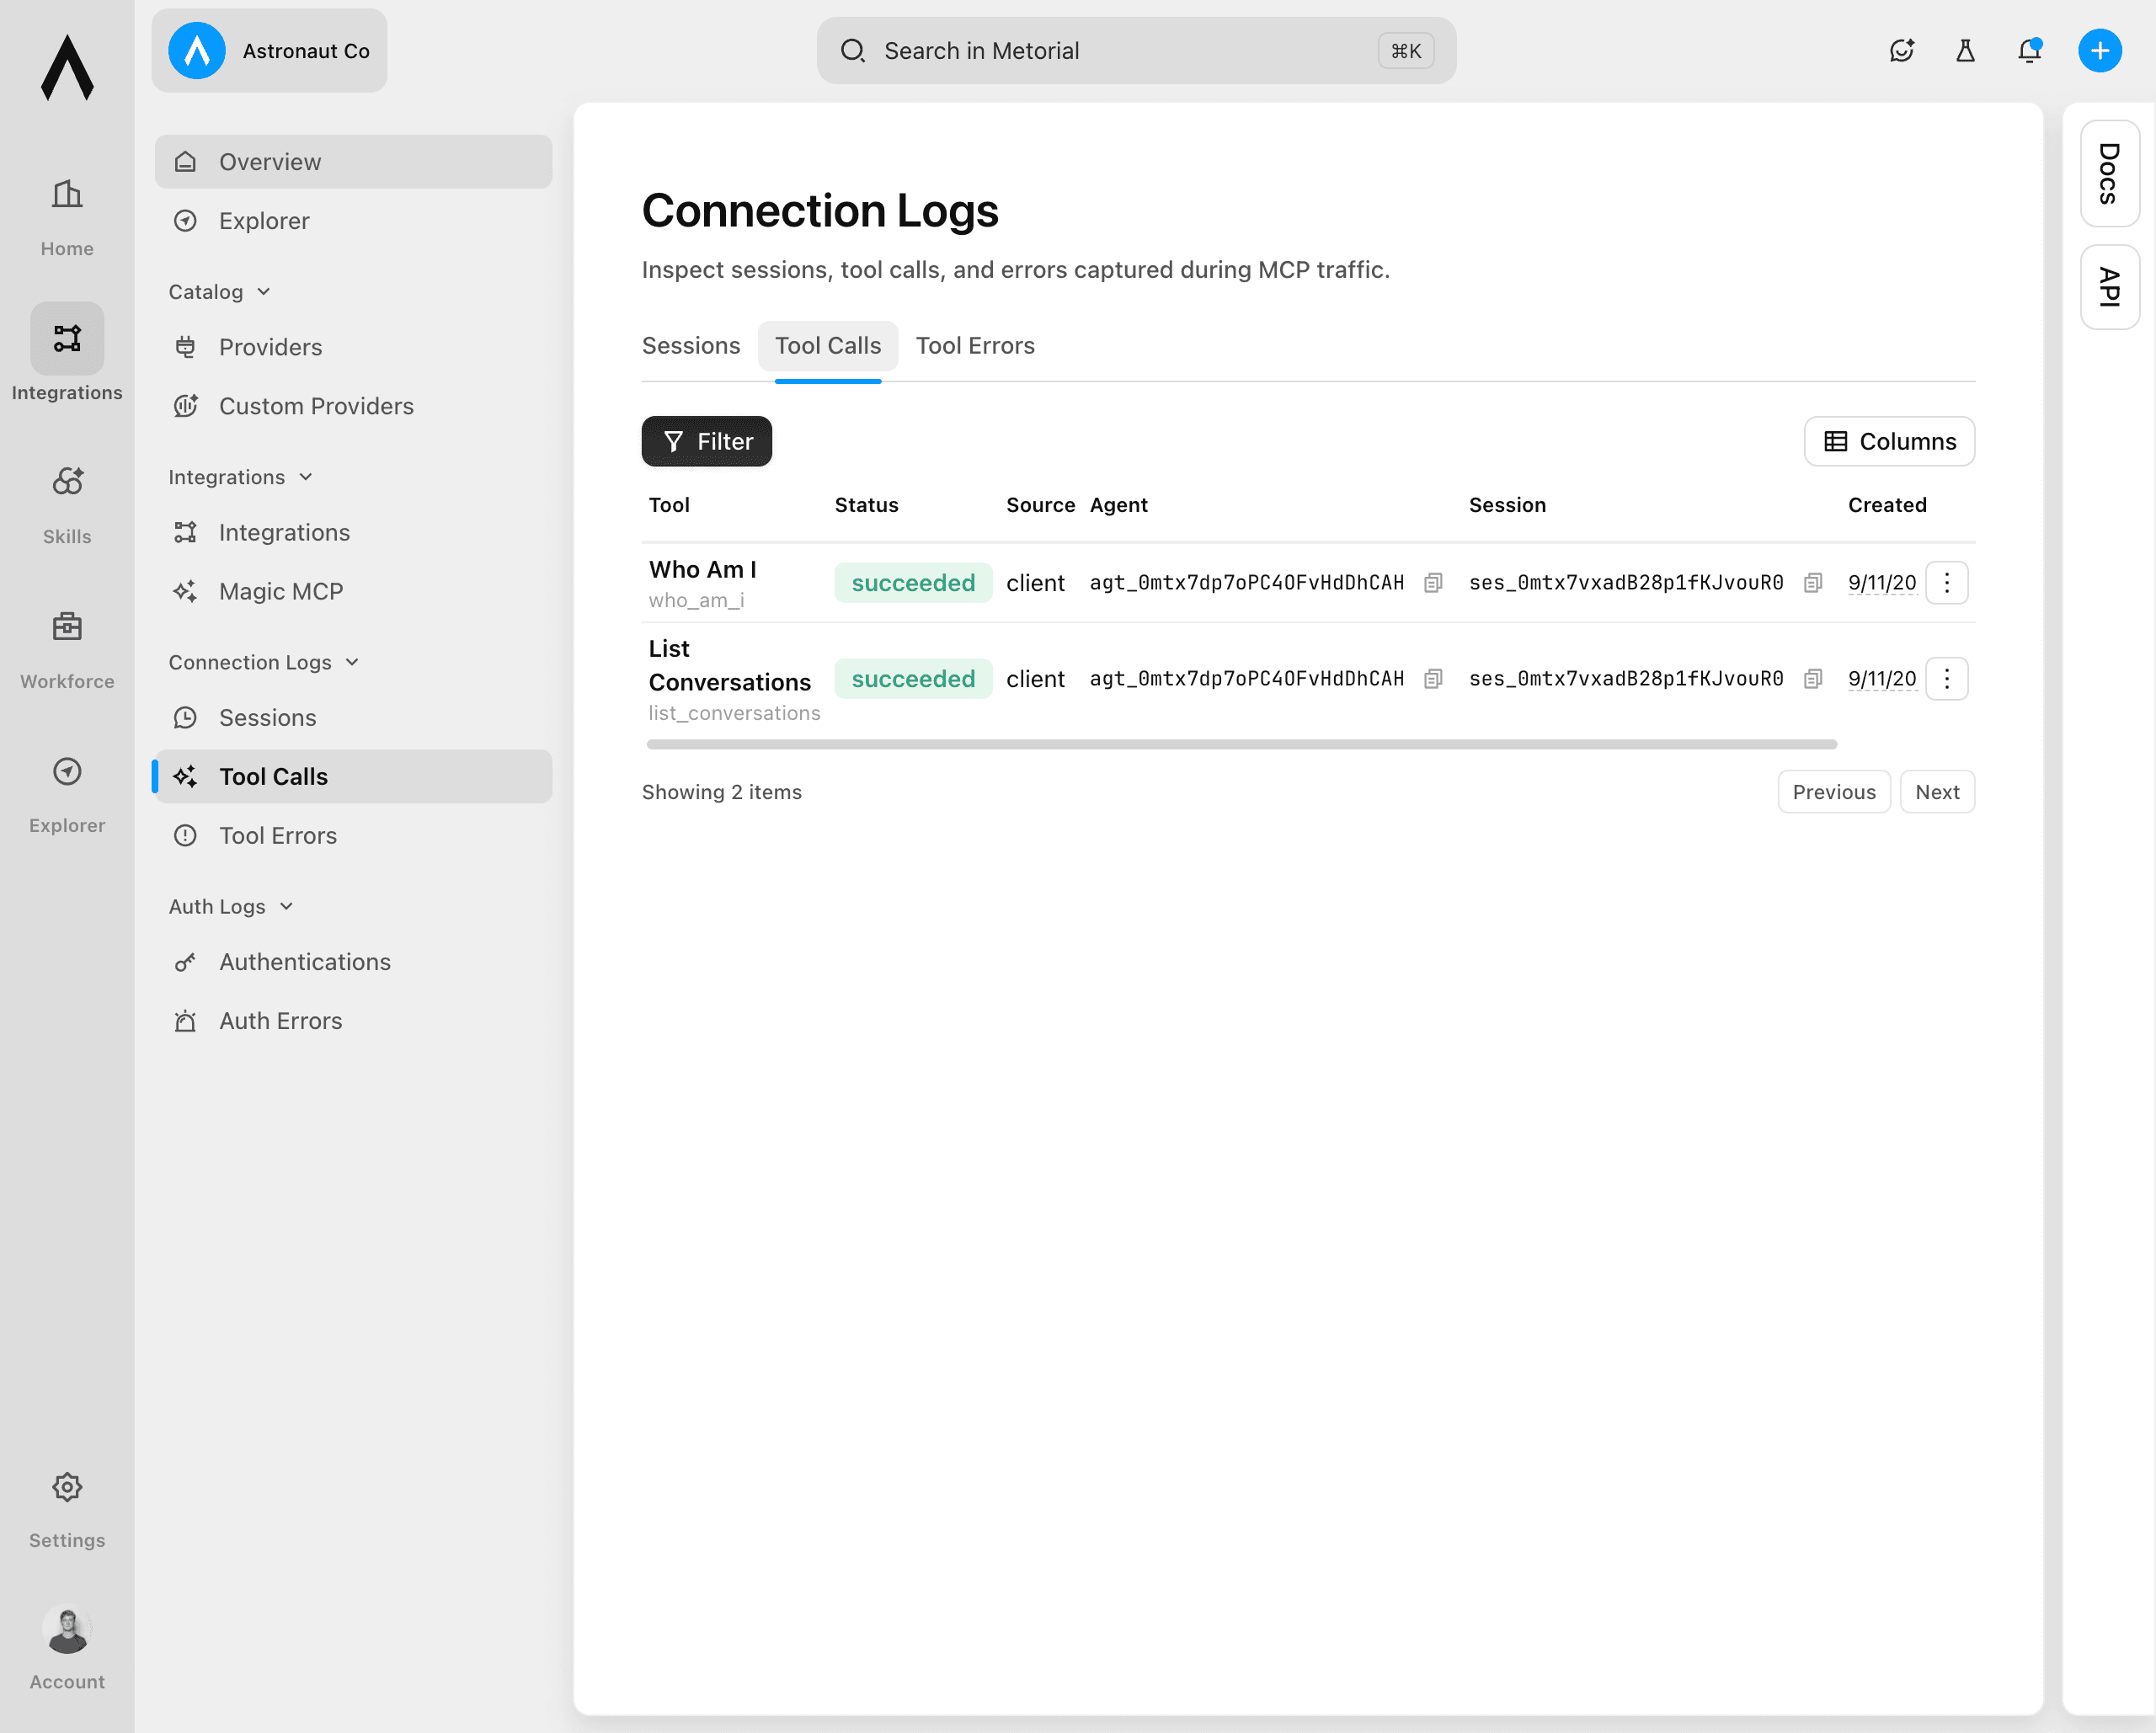
Under Connection Logs, select Tool Calls. This table lists calls from all captured sessions. Use the tool name, status, source, agent, session, and creation time to find a call. Select a row to open its session and call details.
Narrow the results
Select Filter to focus the Sessions or Tool Calls table on the activity you need. To investigate failed calls, select Tool Errors under Connection Logs.
What to check when troubleshooting
- Check the output: Metorial integrations usually provide detailed error messages often with a suggested fix.
- Confirm that the expected provider, deployment, configuration, and authentication configuration were used.
- Check the transport, message counts, and last active time for the connection.
- Read the session timeline in order to see what happened before and after the tool call.
- Compare the tool arguments and result to find invalid inputs, unexpected responses, or missing data.